
Three questions, answered with licence-free simulation.
We run open-source simulators through our own Python workflow: model build, runs, extraction, checks and reporting. Below are three real runs on synthetic models. The figures are simulator output, not animation. No client data is used, and the code stays in-house.
1. CO₂ storage: where does the plume go, and does it stay?
A dome-shaped saline aquifer section with a top seal and two discontinuous shale baffles. CO₂ is injected low in the structure for five years, then the site is shut in and followed for twenty more.
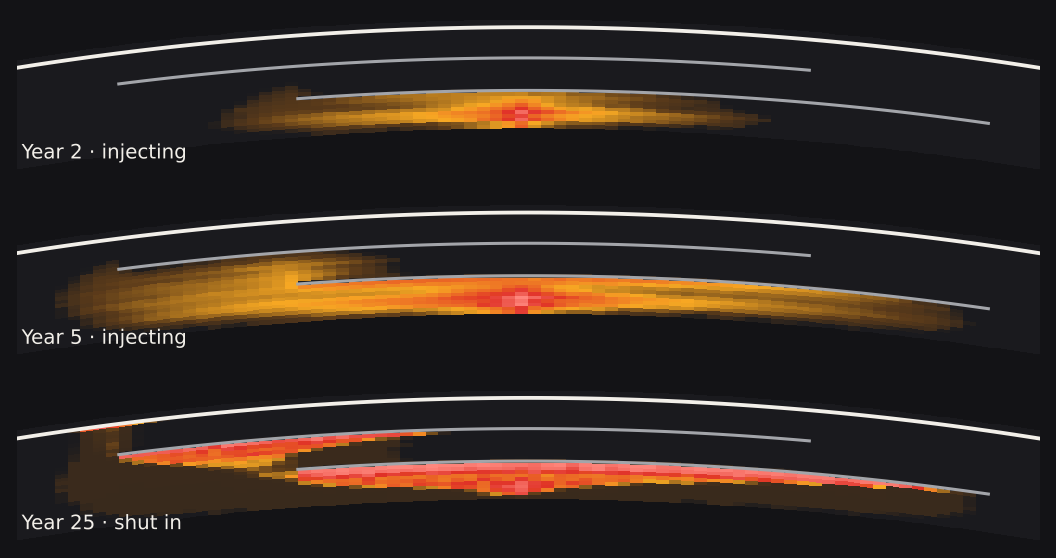
What a study adds: plume extent and trapping by mechanism, the pressure footprint that sets which old wells must be screened, and how both change across the geological uncertainty.
2. Black-oil: will an infill well add barrels, or cost them?
A layered oil reservoir under waterflood, run twice with identical settings: the base flood, and the same flood with an infill producer drilled in year 3.
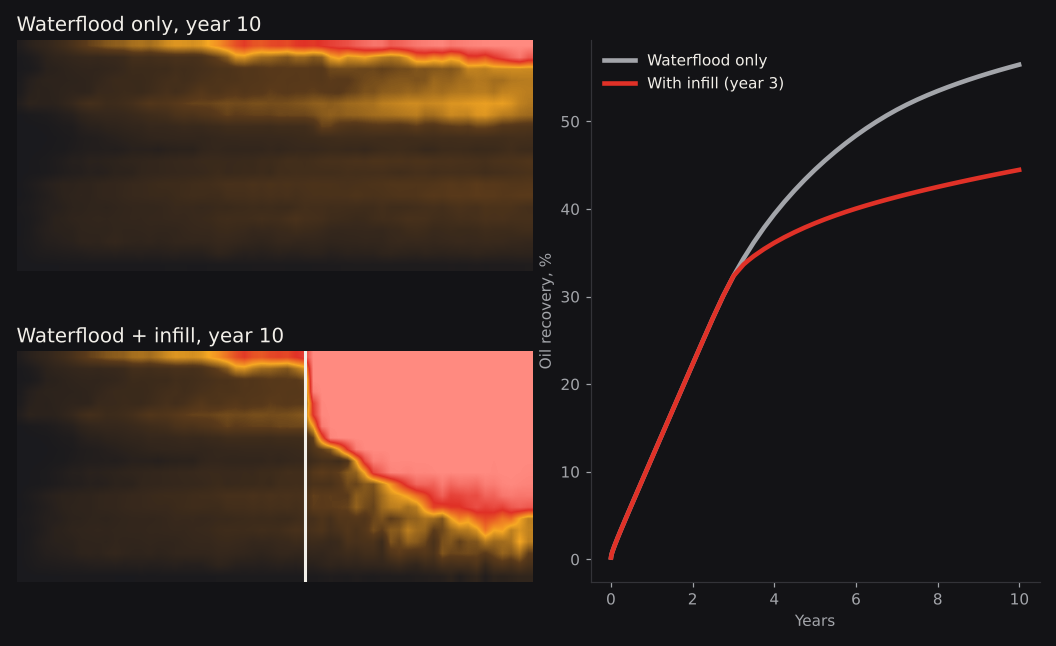
What a study adds: infill, waterflood and gas-handling options run side by side on one model, so a decision meeting sees the trade-offs, not a single forecast.
3. Reservoir souring: when does seawater reach each well?
An areal model with channelised permeability, one central seawater injector and four producers. Seawater carries the sulphate that drives souring, so its arrival time at each producer is the first screen.
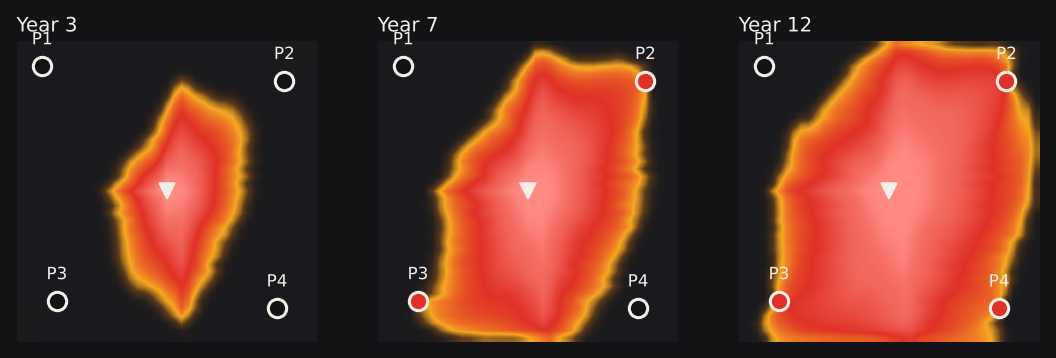
What a study adds: a well-by-well ranking for H₂S monitoring and materials planning, and the basis for a calibrated souring model with biology and temperature where it is needed.
Two ways to work with us
Fast-track study
We build and run the cases and deliver a short decision report. Eclipse-format models usually move across with modest conversion.
Installed in your office
The workflow runs behind your firewall, benchmarked against your current simulator, and your engineers are trained to run it. No simulator licence fees.
All three models are synthetic and illustrative. Results from client models depend on data quality and calibration.